Data Sets
Each data set consists in four components
- a data table whose rows/columns have to be clustered,
- a set of possible row labels,
- a set of possible columns labels,
- a set of parameters describing the generative model employed.
All data sets have been generated from the Latent Block Model with normally distributed entries. They differ in the type of model used:
- either a single variance parameter is shared by all entries of the data table,
- either each block of the data table has its own variance parameter.
Then, the setups differ with respect to:
- table size,
- number of classes,
- difficulty (conditional Bayes' error).
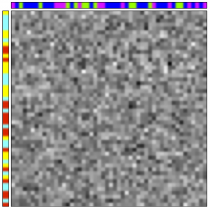
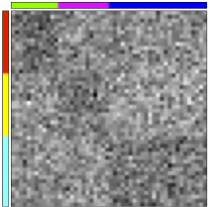
The following figure shows the original data table, which is unsorted, on the left. The left and top sidebars respectively represent row and column class labels. The table is displayed sorted in the center, using an element of the set of possible row and column labels. The right-hand-side summary represents the block average of the sorted data table, that is, the average of the entries sharing identical row and column assignments.
As stated in the list above, we provide several (2000) possible row and column labels, sampled from the distribution of labels given the table (see details in paper). These labels do not cover exhaustively the distribution of labels, but enable to estimate expected performances with respect to the distribution of true labels.
Finally, the parameters that fully specify the generative model employed are provided for information as they may be useful for interpretation purposes.
Data Archives
Each archive .zip corresponds to a type of data sets defined by the error, the size and the number of clusters. It contains 20 folders corresponding to 20 different data sets. Each folder is named by AAA_err_BBB_n_CCC_g_DDD_tab_EEE, where :
- AAA states whether the probabilistic generative model is Bernoulli (binary), Poisson (contingency) or Gaussian with equal variances across table entries (var_eq) or Gaussian with different variances across blocks (var_dif);
- BBB describes the degree of overlap, as measured by the conditional Bayes risk (see paper): there are three categories (05,12,20) respectively corresponding to true error rates in the following intervals (in %): [4, 6], [11, 13] and [19, 21];
- CCC in (50, 100, 200, 500) stands for the table size (that is, the numbers of row/column entries , which are identical);
- DDD in (3, 5, 10) stands for the number of classes (that is, the numbers of row/column classes, which are identical);
The folder contains 4 files in ascii format (entries are tab-separated and lines end with line feeds):
- data_table.txt lists the entries of the data table: each line stands for a row of the data table;
- col_class.txt lists 2000 possible column labels: each line corresponds to a full labeling of the columns of the table;
- row_class.txt lists 2000 possible row labels: each line corresponds to a full labeling of the rows of the table;
- readme.txt specifies the parameters of the latent block model used to generate the data, together with a precise assessment of the difficulty of the task, according to the total/row/column conditional Bayes' error (see paper).


